


Crude Oil Talking Points:
- The collapse in Oil continued into last week’s close, at which point a key Fibonacci level came into the equation.
- Prices have since held that support but sellers were on the prowl again this morning, pushing prices back-below the psychological 70 level.
- The analysis contained in article relies on price action and chart formations. To learn more about price action or chart patterns, check out our DailyFX Education section.

It’s been a big year for crude oil prices. After flopping below zero last April matters have changed quite a bit. Oil prices caught a major last November, on the heels of the election, printing a bullish engulfing pattern as prices jumped back above the $45 handle.
Bullish engulfing candlesticks are often followed for continuation and continue it did, with the next three months in the green and 9 of 11 months higher following that formation.
That went all the way until 82.60 came into the equation, as this is the 50% marker of the 2001-2008 major move. I had warned of this level when it started to come back into the picture six weeks ago. Now, it’s set the high after a big month of bearish price action drove prices back down towards support.
Crude Oil Monthly Price Chart

Chart prepared by James Stanley; CL2 on Tradingview
You’ll probably notice from that above picture, prices have quickly reverted from the 50% marker that’s setting resistance to the 61.8% Fibonacci retracement that’s currently helping to set support.
That level marks the topside of a zone that was in-play back in March as resistance, spanning from 64.31 up to 67.19. That zone had helped to form the yearly high in Crude oil prices in 2019, 2020 and for a few months, 2021. But now that it’s back for support, will buyers be able to hold the lows?
Crude Oil Weekly Price Chart

Chart prepared by James Stanley; CL2 on Tradingview
Crude Oil: Bounce or Breakdown?
From shorter-term charts, it does not appear that the bottom has yet been formed in Crude oil prices. That Fibonacci level has led to a nice bounce, back up to the 72-handle; but sellers went immediately on the attack thereafter and buyers were unable to hold support above the psychological 70-handle.
This gives the appearance of further lower-lows and lower-highs in the mix, and the bottom portion of the current support zone may help with some guidance. I’m marking the bottom of that zone at 64.31, and the 65 psychological level comes into the picture along the way. If this area can’t hold the lows, there could be an aggressively bearish move but, for now, the look is on bearish trend continuation with a deeper push into that long-term support zone.
Crude Oil Four-Hour Price Chart
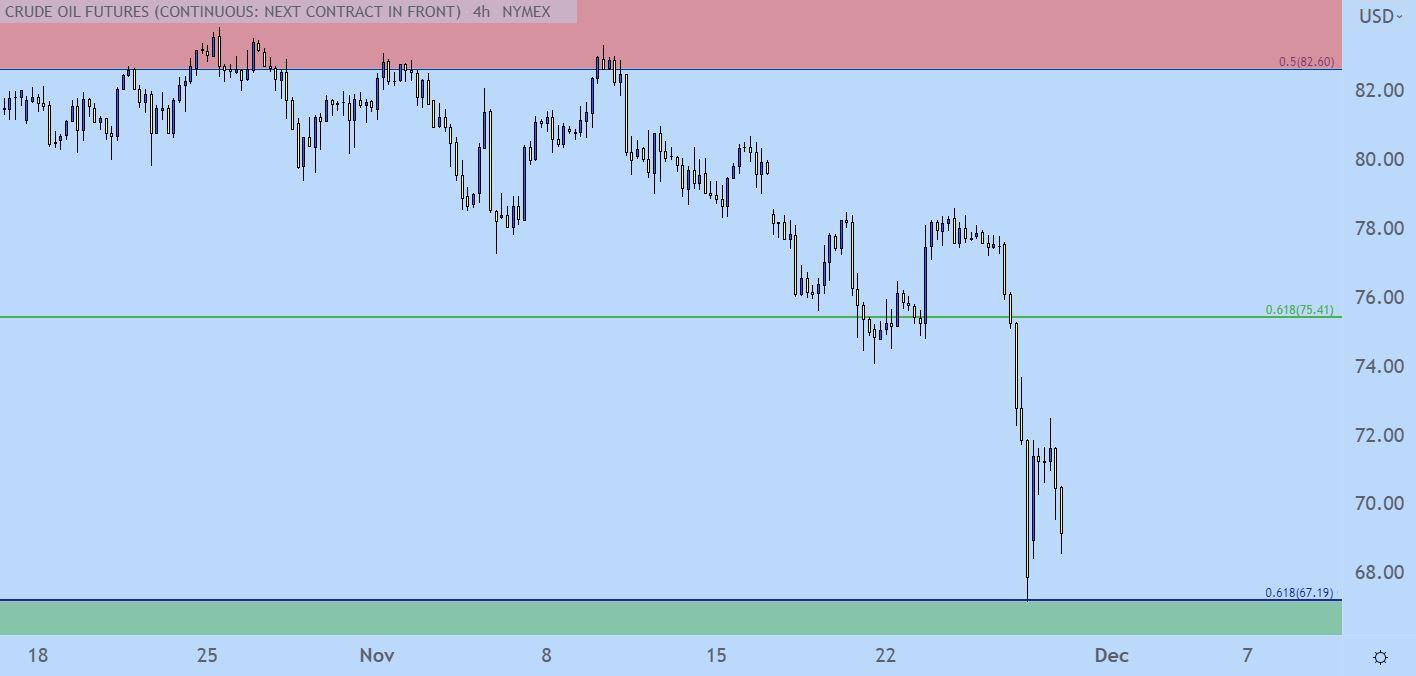
Chart prepared by James Stanley; CL2 on Tradingview
--- Written by James Stanley, Senior Strategist for DailyFX.com
Contact and follow James on Twitter: @JStanleyFX


